


By Kimberly L. Morgan
The U.S. commercial blueberry industry value of utilized production was $933 million in 2020. An unchanging trend since 1970, the U.S. consumer continues to eat less than 40% of the federal dietary guidelines of fruits and vegetables [U.S. Department of Agriculture (USDA), 2021] and only 12% meet fruit intake requirements (Seung Hee Lee-Kwan et al., 2017).
Since berry quality is highly dependent on careful harvesting, sorting, cooling, packaging and shipping, the industry is characterized as labor-dependent and favors adoption of best management techniques to improve yields. Industry concerns include labor availability and costs, infrastructure investments, and alternative production and marketing practices, with the goal of improving industry profitability.
PRODUCTION
Highbush (northern and southern) and rabbiteye cultivars require milder growing conditions compared to lowbush plants, with both types thriving in well-drained, acidic soils and benefiting from irrigation and pruning. Rabbiteye varieties are native to the southeastern United States, producing a slightly sweeter fruit with a tougher skin that is tolerant of machine harvesting (Fumiomi Takeda et al., 2008).
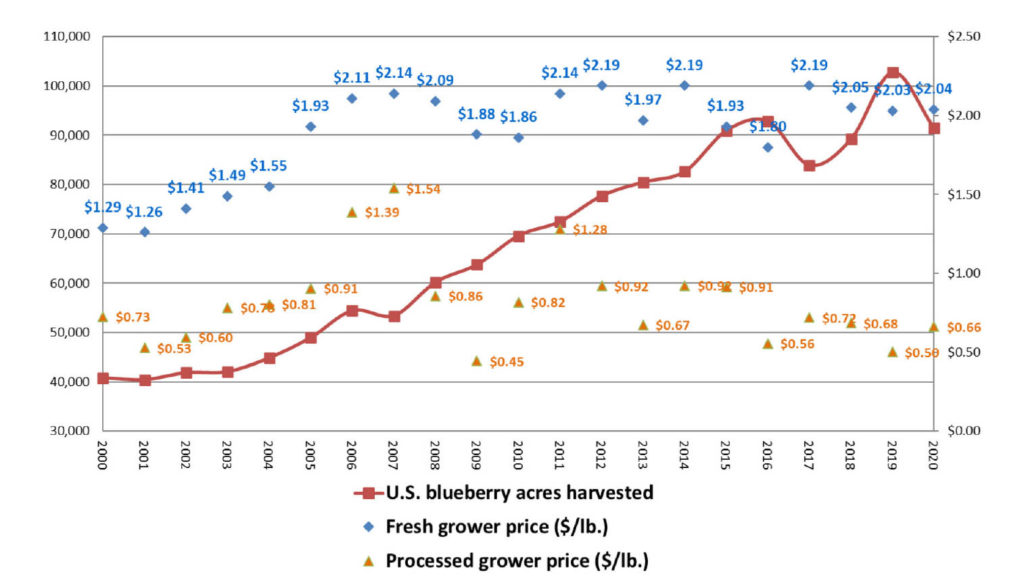
Annual harvested U.S. blueberry acreage has increased from 40,820 to 91,400 from 2000 to 2020 (Figure 1). In this same period, average blueberry yields increased from 4,480 to 6,630 pounds per acre, and the value of utilized production jumped from $177.8 million to $904.8 million.
Georgia, North Carolina and Florida were among the top eight producing states, with 21,700, 7,500 and 5,200 acres harvested, respectively. This represents 30% of all U.S. blueberry acreage, with farm gate values of $256.2 million (USDA, National Agricultural Statistics Service, 2021).
PRICES
While yields are relatively lower compared to northern growing states, ranging from 4,160 to 4,740 pounds per acre, grower prices are relatively higher, from $2.64/lb. in Florida to $1.42/lb. in Georgia.
In 2000, grower prices averaged $1.29/lb. for fresh berries. In 2007, prices rose to $2.14/lb., which encouraged new and existing growers to plant several thousand additional acres. As these new plantings reached maturity from 2010–2020, grower prices initially dropped down to $1.86/lb. in 2010 but recovered to $2.04/lb. by 2018.
Processed blueberry prices initially doubled from 2000–2007, increasing from $0.73/lb. to $1.54/lb. But by 2009, these prices dropped to $0.45/lb. and recovered to $0.66/lb. in 2020 (Figure 1). Despite this price disparity, just over half (55%) of cultivated blueberries grown in the United States were sold as fresh product in 2019 (USDA, National Agricultural Statistics Service, 2020).
IMPORTS
U.S. fresh blueberry imports increased tenfold from 46.5 to 472.5 million pounds from 2002 to 2020. In 2020, Peru, Chile and Mexico provided 184.2 million, 115.4 million and 112.8 million pounds, respectively. Total imported fresh cultivated blueberries were valued at $1.23 billion, a significant increase over 2017 import values of $841 million (USDA Economic Research Service, 2021).
MARKETING AND CONSUMPTION
In 2000, the North American Blueberry Council voted to establish a federally mandated marketing and promotion order. The U.S. Highbush Blueberry Council (USHBC) members voted to impose an assessment rate of $18/ton in 2012, raising the rate from an initial level of $12/ton. Resulting funds were invested in medical research trials which have documented the health benefits associated with blueberry consumption and motivated the promotional messaging to inspire consumers to “grab a boost of blue” (USHBC, 2021).
Fresh blueberry consumption rose from 79.1 million to 373 million pounds from 2000 to 2019, while processed consumption rose from 103.8 million to 300 million pounds over the same time (USDA, 2021). In 2020, Harry Kaiser of Cornell University estimated the average increase in net revenue due to a 1% increase in promotion spending by the USHBC is $978,300 per year. He noted that an additional one dollar spent on promotional efforts would generate $18.74 in returns to blueberry growers. Given this record of success, the blueberry industry voted to continue the program in 2021.
GROWER CONCLUSIONS
As evidenced by the improved U.S. demand for blueberries, coordinated research and promotion efforts have proven successful drivers of industry profitability. Produce buyers possess the market data metrics and timely analytics while growers are capable of manipulating inputs and varietal choices. Adopting a “grow-on-demand” approach built on shared data analysis between producers and retailers may allow the industry to capture added revenues and provide higher quality fresh berries to consumers.
U.S. growers continue to experience labor-supply limitations and trade challenges (U.S. International Trade Commission, 2021), as increasing imported volumes suggest relatively lower costs incurred by importing growers (Wu and Guan, 2021). While machine harvesting is available, the opportunity cost of adopting technology must be weighed against potential lost revenues, given 2020 prices received for processed berries were just 32% of fresh prices. Historically, mechanical harvesting of blueberries was limited to rabbiteye varieties more tolerant of machining or late-season fruit destined for the processing market.
Given ongoing worldwide transportation snags, investment in early and late varietal plantings and high-tunnel production offers growers the opportunity to improve profitability by targeting the fresh market windows of November through March when grower prices are four times higher. Investment in season manipulation techniques has proven profitable in Mexican blueberry production (Feng Wu and Zhengfei Guan, 2021). Florida berry growers are advised to conduct enterprise risk evaluations of open-field and protected culture, such as high tunnels.
Driven by pandemic lockdown conditions, online grocery shopping grew from $62.2 billion to $95.8 billion in just one year. By 2024, it is predicted to exceed $187 billion, led by Amazon and Walmart. Food and beverage retail e-commerce revenue in the United States boomed from $9 billion in 2017 to $18.7 billion in 2020 and is expected to grow to nearly $26 billion in 2021 (Andrea Blázquez, 2021). In both cases, the individual selecting the fresh produce to place in the shopping basket is not the end user and oftentimes not a berry consumer themselves, given just 43% of consumers reported eating blueberries (M. Shahbandeh, 2021).
As indicated by these trends, a differentiated approach to marketing of fresh berries may prove fruitful. For example, at the retail level, provide shopper educational messaging at point-of-purchase as to how to properly identify and select product quality. Growers may consider investment in logistics to prioritize delivery of premium berries where quality-control measures are ensured to gain direct access to markets aimed at shortening the shipping period.

Kimberly L. Morgan is an associate professor and Extension economist at the University of Florida Institute of Food and Agricultural Sciences Southwest Florida Research and Education Center in Immokalee.